Automattic is a globally distributed company and a few times each year, we come together for a meetup to align on team strategy and to forge stronger relationships. During these meetups, we tend to work together on various projects, sometimes called “hack projects.”
These projects bring together people from various backgrounds and divisions to solve a certain problem. This year, I worked with a lovely group of people as part of our data community meetup to figure out a better way to quantify and understand user product feedback that comes through our support requests.
This post, originally authored by George Jeng for our company’s internal communication forum (P2 Theme), has been adapted for this public blog. The team members who contributed to the original discussion include Jesse Akes, Stefano Barzaghi, Joao Amaral, Zvonimir Tomas, George Jeng, Matthew Miller, Brian Abelson, and Daniel Danilov.
The Problem
The existing support team at Tumblr provides users with an online feedback submission form. However, managing the influx of feedback presents a challenge, with daily submissions ranging from 40 to 700 requests. This volume becomes particularly overwhelming when we introduce new features. Consequently, we struggle to effectively comprehend the messages users are sending us, which results in a missed opportunity to gain valuable insights from our community.
What’s the goal of this project?
The objective of this project is to create a tool that empowers Tumblr staff to efficiently grasp the essence of incoming feedback. This tool will equip our team with the capability to aggregate and delve deeper into feedback that shares common themes. We aim to provide Tumblr staff with a user-friendly tool for gaining insight into the context of support requests, analyzing requests within specified timeframes, and conducting in-depth exploration of feedback by considering the sentiment of requests and keywords mentioned in the tickets.
The Proposed Solution
To create an all-encompassing dashboard for staff to easily grasp feedback, our overarching approach involves the following key steps:
- Data Categorization: We will systematically categorize feedback into distinct sentiments and themes.
- User-Friendly Filters: Users will have access to intuitive filters that allow them to sort feedback based on sentiment, themes, and date ranges.
- Automated Weekly Reports: Our system will automate the generation of weekly reports, presenting Tumblr teams with a comprehensive summary of all feedback received during the preceding week.
- Trend Identification: We’ll empower users to identify emerging trends and patterns through insightful visualizations.
In seamlessly integrating these components, our goal is to provide staff with a centralized hub for feedback comprehension, ensuring a streamlined and efficient feedback analysis process.
What We Did

Data Extraction
We pulled out the feedback tickets from Tumblr’s Zendesk instance using Meltano, and loaded the data into Tumblr’s HDFS instance.
Classification
When we originally designed this project, we thought we had to create separate processes, respectively, for the sentiment analysis, keyword extraction, and summarization. But with the availability of ChatGPT, we were able to consolidate all these processes into one Jupyter script.
The ChatGPT prompt we used was..
| SYSTEM_PROMPT = “”” You are a helpful AI assistant that classifies Tumblr user feedback based on what features they are talking about. \You will be given a list of common features and issues that other Tumblr users have talked about. Each feature \will have a title, a short description of what users have said about that feature, a list of important related \keywords and a summary of user sentiment about the feature. These will be encoded in a json format. You will then be given a single user comment and you will determine which of those features the user is talking \about. Respond with exactly the title of the feature as listed. \If they are not talking about any feature in the list you will respond with “Other”. You will also \determine the sentiment of the user’s comment. You will:1) Choose the feature from the list that is most related to the user’s comment.2) Refer to the feature by the exact title that it is given in the list.3) Do not create new features or feature titles. 4) If the user’s comment does not match well with anything in the list of features then use the title “Other”.5) Classify the sentiment of the user’s comment as one of the following: VERY NEGATIVE, SOMEWHAT NEGATIVE, NEUTRAL, SOMEWHAT POSITIVE, VERY POSITIVE Respond only in the following json format: {“feature”:<Title of the feature they are talking about>,”sentiment”:<One of VERY NEGATIVE, SOMEWHAT NEGATIVE, NEUTRAL, SOMEWHAT POSITIVE, VERY POSITIVE>} Here is the list of features to choose from: “”” + TOPIC_LIST USER_PROMPT = “”” Here is the user comment for you to classify: {comment}{add list of topics here with additional criteria as necessary} “”” |
Visualization
In terms of visualizations, we built two prototypes, one in Looker and the other in Superset. The visualizations below use a sample dataset to help provide a realistic representation:
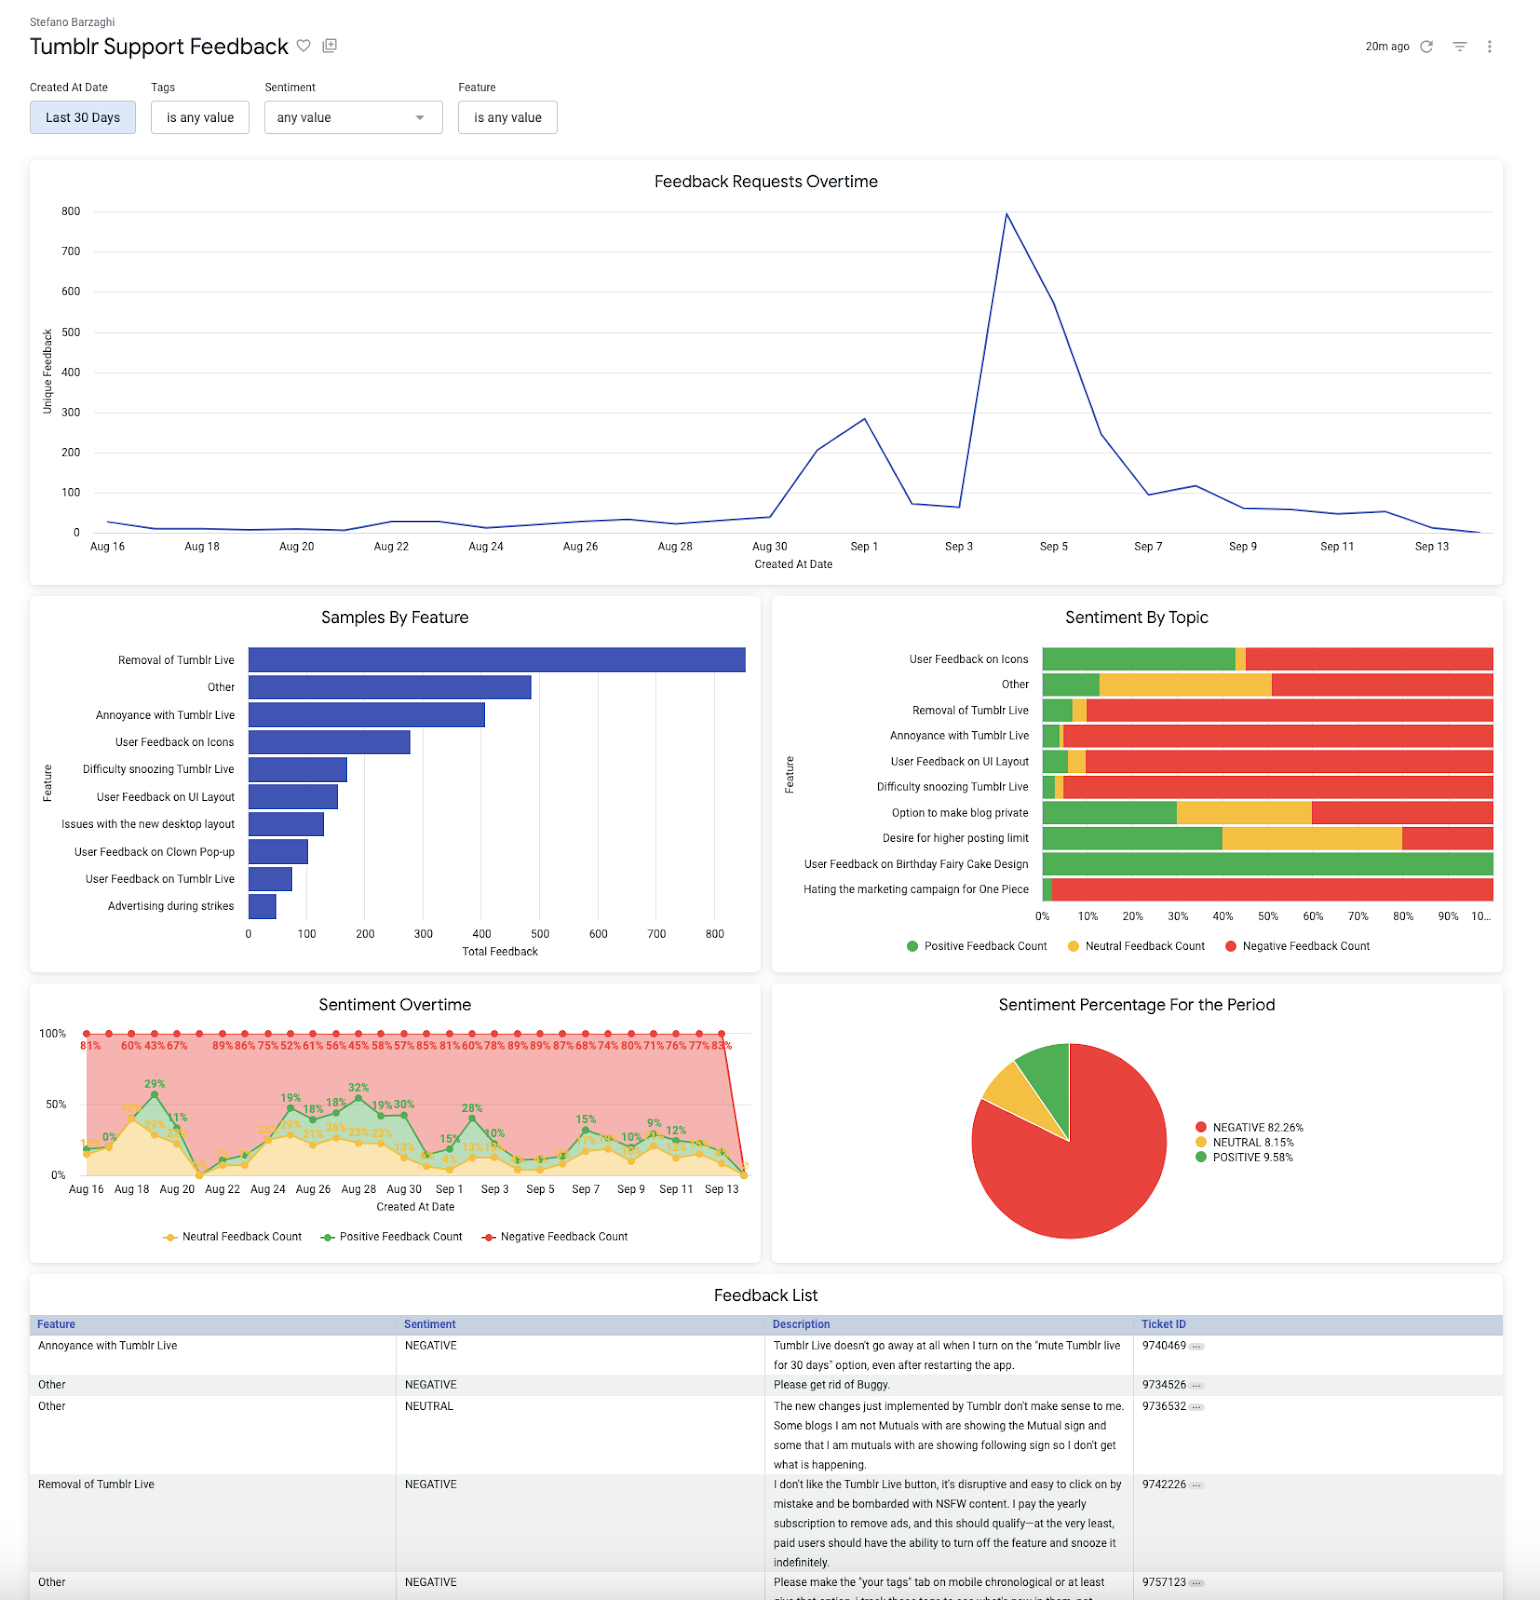
Alt Text: Image of a Looker dashboard displaying data parsed from customer support feedback. The dashboard includes various charts and graphs such as bar charts, line graphs, and pie charts, illustrating metrics like customer satisfaction scores, common issues, and response times.
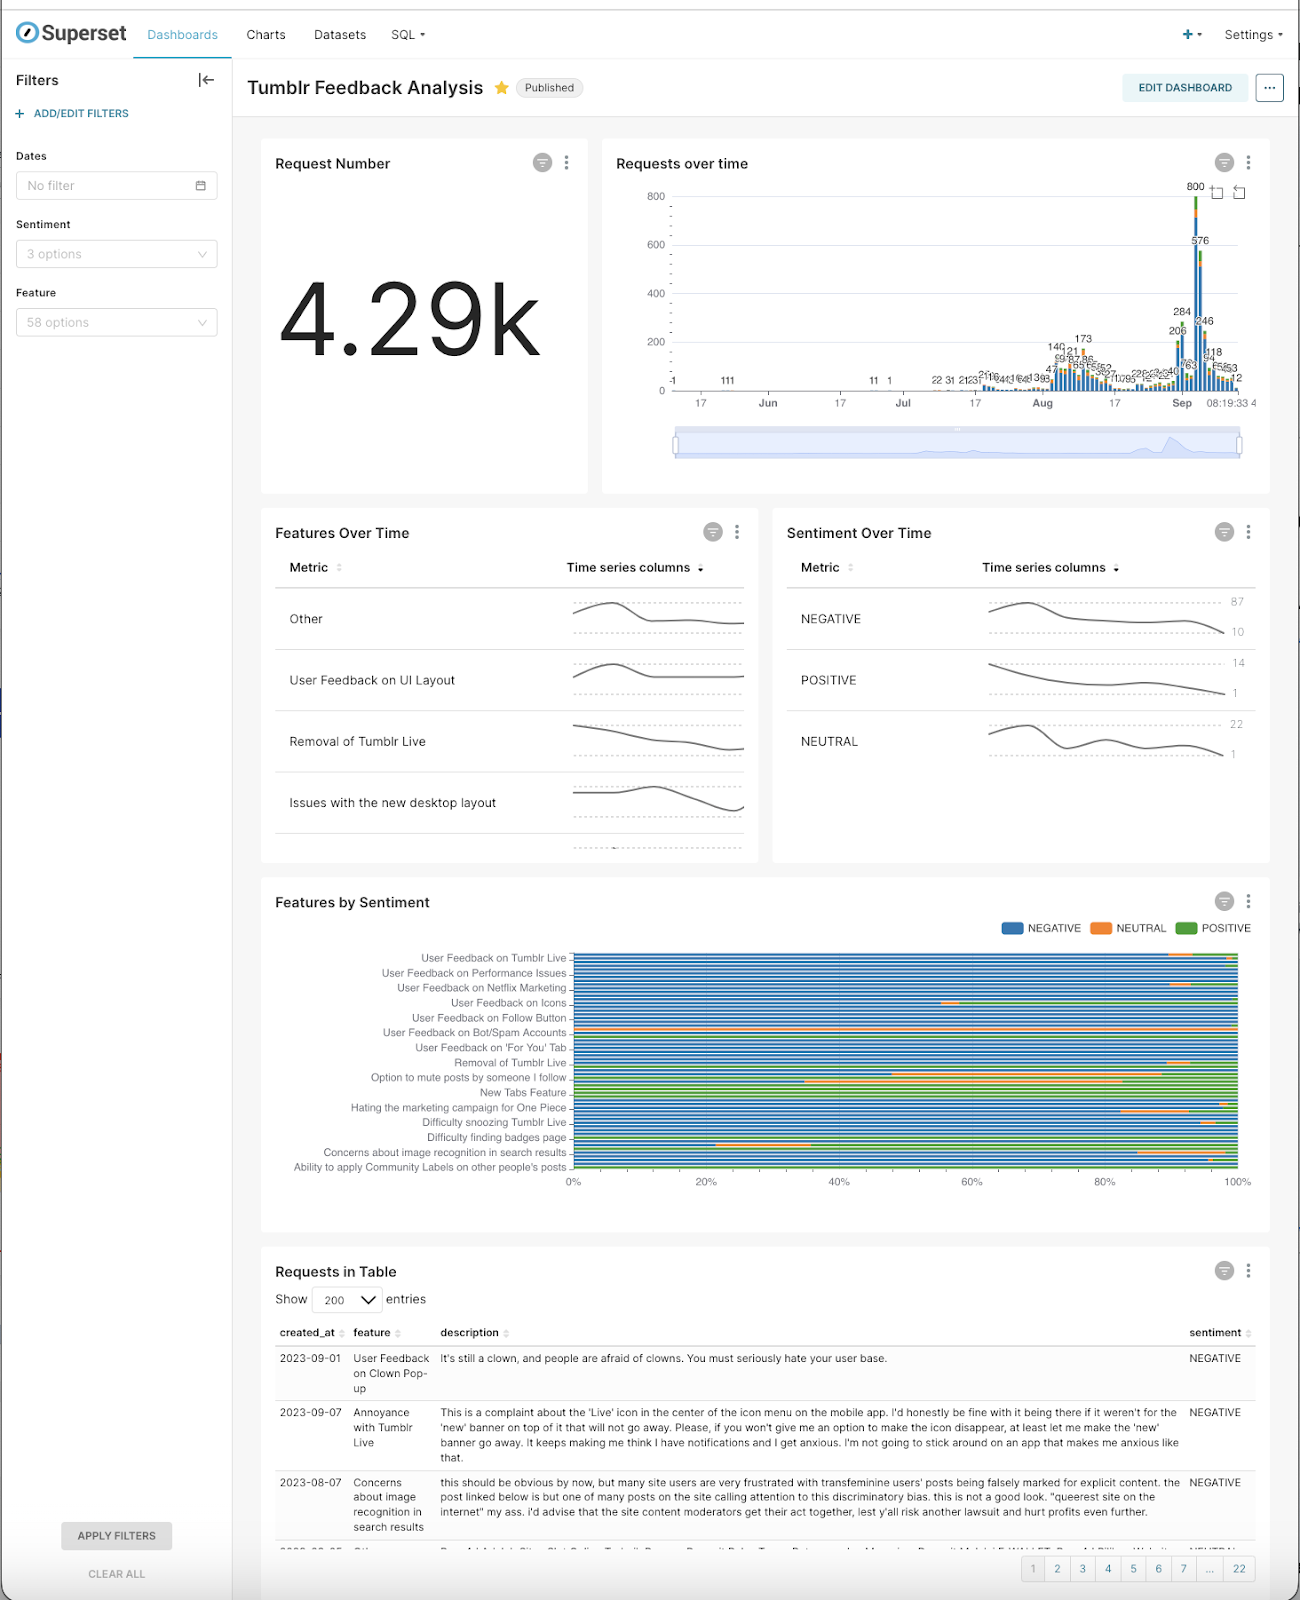
Alt Text: Image of a Superset dashboard visualizing data derived from customer support feedback. This dashboard features an array of data visualizations including histograms, scatter plots, and area charts, showcasing insights into customer queries, resolution efficiency, and feedback trends
What we learned
- What’s AI Good For? – OpenAI is best used for one-off summarization or simple problems like sentiment analysis. Using it to accomplish sophisticated tasks in a reliable manner is really hard, often due to challenges in understanding complex context, the need for vast, high-quality data, maintaining consistency across each prompt, and limitations in current AI algorithms’ ability to mimic advanced human reasoning.
- Prompts as Programs – To prevent unpredictable behavior and ensure reproducible results with AI, It’s best to break prompts down into small pieces. Combine the pieces in logical sequence to create complicated programs.
- Far Out Dude – Despite prompting OpenAI to classify comments with specific features and return a strict schema, it still hallucinated new classifications and output formats. This required changing our pipeline to handle these edge cases.
- Speed Counts – In hack projects with tight deadlines, the speed of querying is crucial. When using certain infrastructures, queries can be excessively time-consuming, significantly hindering progress and affecting the project’s overall efficiency. This delay not only impacts the ability to iterate quickly but also constrains the scope of experimentation and development, which are key in a fast-paced hack environment.
- Diversity Matters – Having team members from a variety of backgrounds meant that people responsible for individual parts of the pipeline all had a say in how other parts of the product functioned.
Closing words
At the end of the hack project, we had managed to wrap up a working version of the tool. Our fellow Automatticians have since then expressed excitement about the tool, and also provided us with helpful feedback. Our team ended up winning first place in our internal Hack Week Awards!
Overall, this hack project was a lot of fun and also a great learning experience for everyone. We all feel happy to have contributed to a feedback tool that can impact the future of the product. We hope our customer-driven feedback can help inspire higher productivity, and create a more enjoyable working culture within Automattic.
What hack day projects has your team worked on? What did you learn? Please share your thoughts in the comments.
