This week, Boris, Demet, Charles, and Sirin offer pieces on data visualization, deep learning architecture, the “Dirtbag Left,” and an obituary for the late Hans Rosling, a man who “had a talent for using numbers to tell exciting stories” — largely about the world becoming a better place. Enjoy our recommendations below and remember to share your thoughts and incisive data reads in the comments.
Boris Gorelik
 I recently came across hand-drawn infographics by W.E.B Du Bois — an African American activist and historian who was born in the United States one year after the Civil War ended. The entire infographic collection was inspiring in three ways: first, I learned about an incredible man (I can’t imagine how hard it was for him to achieve what he achieved.) Second, the story that Du Bois’ graphs tell is notable too: you can see the struggle, the suffering, and the willingness to integrate — all by the data. Last, being a data visualization enthusiast, I can’t stop adoring the technical details of these illustrations — especially how information-rich they are.
And now over to you! What do you think of hand-drawn graphs? They were a necessity back in the 19-20th century. Do they have any value, except for an artistic one, today? See this collection to understand what I’m talking about. Share your thoughts in the comments.
Demet Dagdelen
 Devin Gaffney, a PhD candidate at Northeastern’s Net Scilab, discovered a subculture on Twitter — “the Dirtbag Left” — who had their own NCAA-style, bracket-based competition on Twitter. He wrote a series of algorithms to predict the results of the tournament. In this post, he describes his thought processes (and the code) for the successful model he eventually ended up building. I like this post a lot — especially because of the tongue-in-cheek approach it has for the statisticians of Twitter and the rhetorics they use.
Charles Earl
 In this post Chris Olah, a researcher on the Google Brain team, sketches how popular deep learning architectures can be described in terms of abstractions from functional programming languages. The interesting thing here is that functional programming languages (like Scala, Haskell, and OCaml) provide very solid abstractions for both composing programs and reasoning about their behavior. This could be a way to make the development and testing of complex machine learning programs a lot easier.
What do you think: how far can we take this approach? Does it make it easier to develop new deep learning systems? There has been a lot of discussion this post. I’m curious to know how other data science teams might be using it in practice. Share your thoughts and ideas in the comments.
Sirin Odrowski
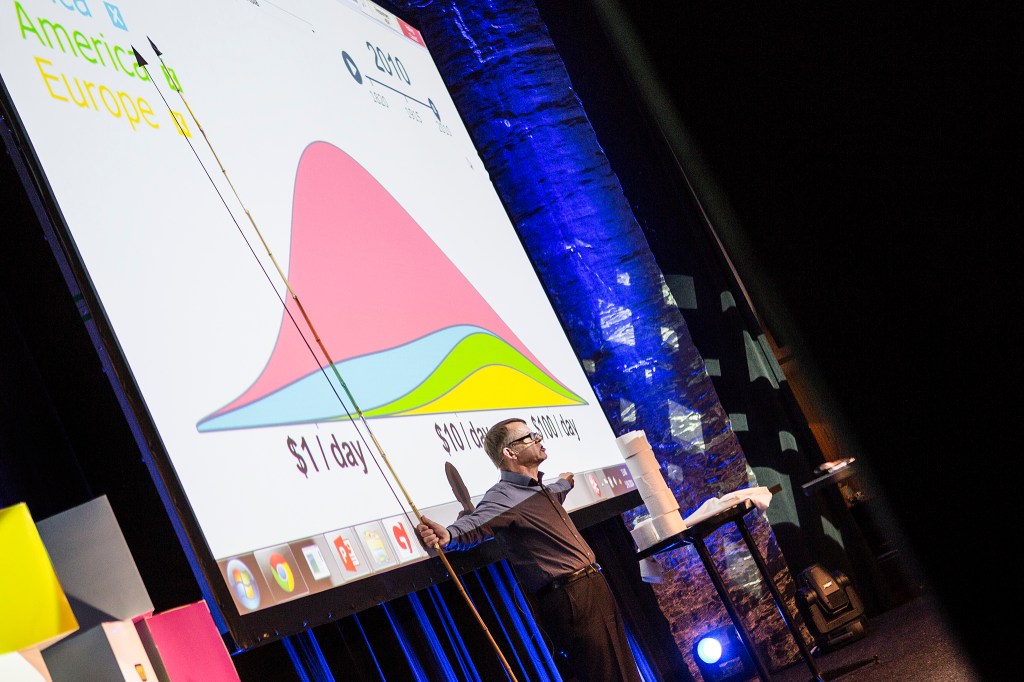
 Hans Rosling, a Swedish statistician, physician, and educator with a unique way of bringing data to life, passed away this month. The article I am sharing is an obituary published by The Economist, but this is also a good time to (re-)watch his TED talks, or to explore the inspiring data visualizations created by his non-profit organization, Gapminder.
Considering Rosling’s work, do you know any other great educators who work with data in unique ways?


Leave a comment