As an organization that relies on data in their operations, Automattic needed a good way to make its data catalog searchable and accessible to anyone in the company. At first, we considered using external, already‑available tools, such as Avrodoc (which we actually implemented) or Amundsen. While this might have reduced development time, we also saw a couple of important drawbacks:
- I can’t find the tables using the internal search! – While almost all documentation in Automattic is searchable (including the one in GitHub), data handled or stored in a new interface would not be easily covered by our internal search engine.
- Wait, another tool? – Asking everyone to start using yet another interface poses a risk to adoption. No one likes to switch between dozens of interfaces and login multiple times every day.
- This is cool! But what about this other data source we use? – In Automattic we consume data from multiple sources. Some datasets are defined in a standardized way (like the table schemas in our Hadoop cluster), but others are less conventional and not available for implementation.
- Great tool! But look, I’d change this and that… – External software is difficult (or impossible) to modify and adapt to the specific needs of our users.
Our own solution!
Given that we are a company built on open source software, we wondered, what if we transform the software we are all used to (WordPress!) into our definitive Data Discoverability solution?
We already had the necessary ingredients for this magic recipe:
- WordPress REST API – Everybody in Automattic uses P2, a WP‑based internal communication tool. By automatically publishing pages to it, we can make information available in an environment that’s already part of everyone’s workflows. We can do so by providing the content and format with HTML and CSS.
- Our Apache Hadoop cluster – Where we define and process most of our data (see Data Sources).
- TeamCity – Our on‑premises TeamCity installation can execute Python scripts in a scheduled way, and also let us execute them in test environments prior to production.
- GitHub – So we can have versioned files of our dataset schemas and elements, constantly updated and available for crawling and reading.
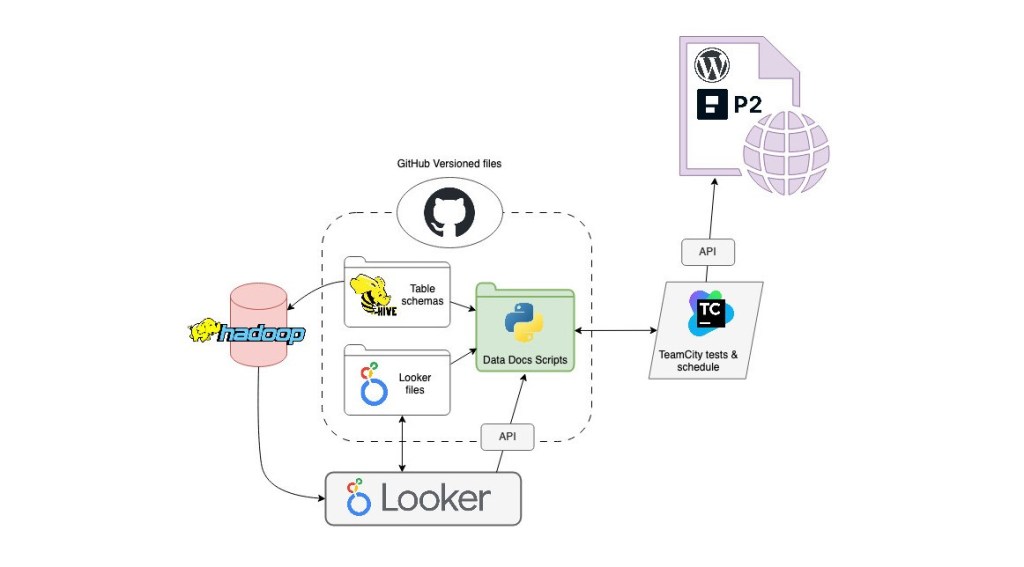
In short, the recurrent interactions of these four elements make it possible to publish our target metadata. We have dedicated Python scripts that TeamCity executes on a daily basis. They crawl and inspect files in our cluster, versioned and updated via GitHub, and then extract the information we need and publish it in a friendly format to WordPress‑based P2 pages that are accessible and searchable by our main internal tools.

The Data Sources
At this moment we work with two related but different data sources. It’s not the purpose of this post to fully describe them, but I believe it’s relevant to explain a bit how they could be integrated in our data docs.
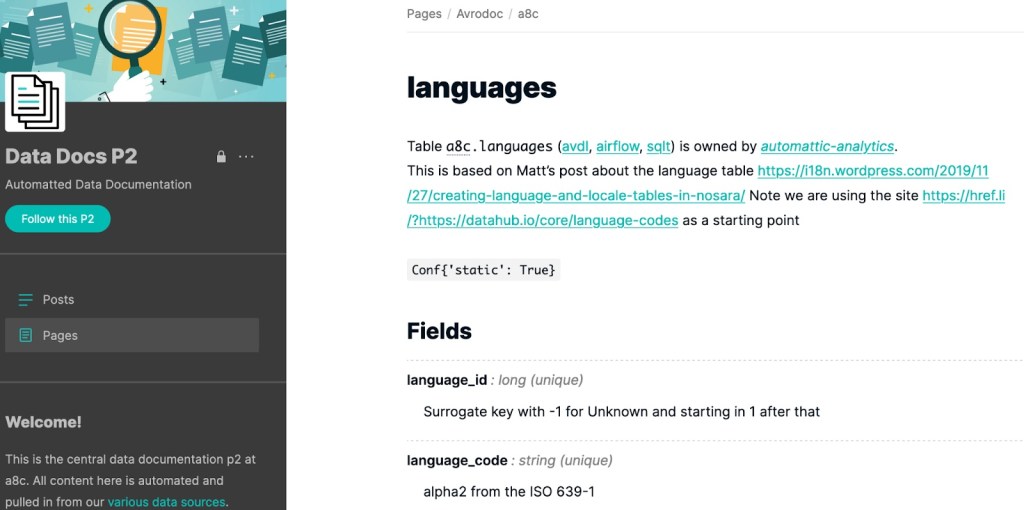
Hive tables
We have our own internal tool for transforming data, named SQLT. As many other ETL processes, it requires certain definition documents to produce tables: the schemas. The table schemas not only contain the table and fields’ metadata, but also annotations in the Apache Avro schema convention.
Looker
Looker is our main data visualization tool; we have a self‑hosted installation. In addition to charts and dashboards, it transforms and generates its own data (usually from the Hadoop tables). Quoting the Looker documentation:
A Looker project is a collection of LookML files that tell Looker how to connect to your database, how to query your data, and how to control the user interface’s behavior.
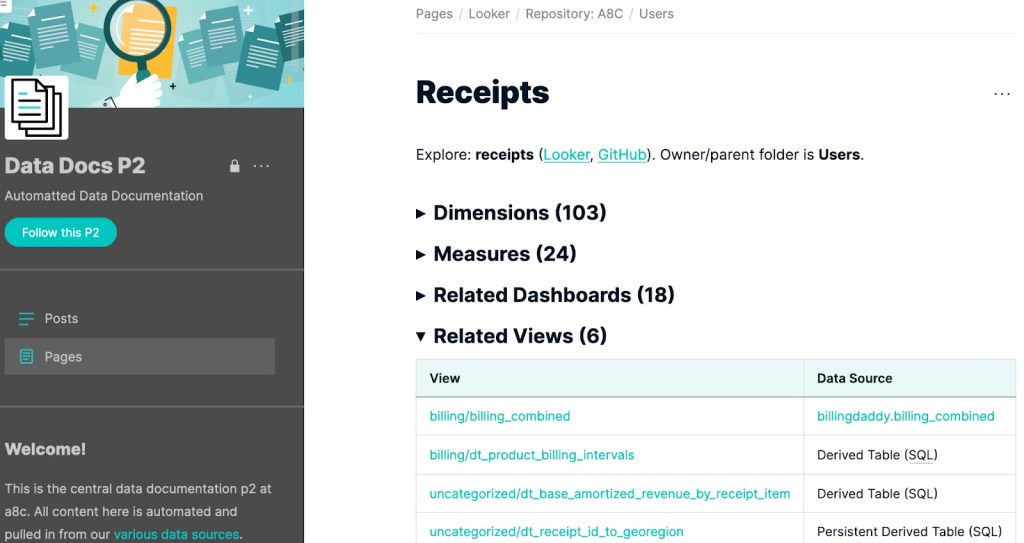
Our users and developers are interested in having accessible information on Looker’s containers and hierarchies (models, views, explores…) and fields (dimensions, measures…). Fortunately, Looker offers API access, and its project files are also versioned via GitHub.
The WP page hierarchy we’ve enabled for this page is: Project/Repository > Model > Explore. Here’s an example of how it looks:

Conclusion
WordPress is a versatile publishing tool that can be used for many purposes besides the traditional blog. With this cross‑data team collaboration, we have leveraged a tool that we’re already using and investing in as a company to make our data more discoverable internally, with everything available in one single place.
How are you meeting your data discoverability needs? Are you using any existing tool, or did you build your own solution? We’d like to hear about your experiences!


Leave a comment