


Ordinarily, data scientists spend a lot of time trying to predict the future. Time‑series prediction, recommendations, even next‑token‑prediction…they’ve all broadly got the same flavor. Recently, however, I came across a problem with a distinctly different taste, and I’d like to share it with you today: predicting the past.
Surely predicting the past is pretty easy, right? You look at what happened…and then…well, that’s what happened.
Alas, if only things were that easy.
Growth of the web
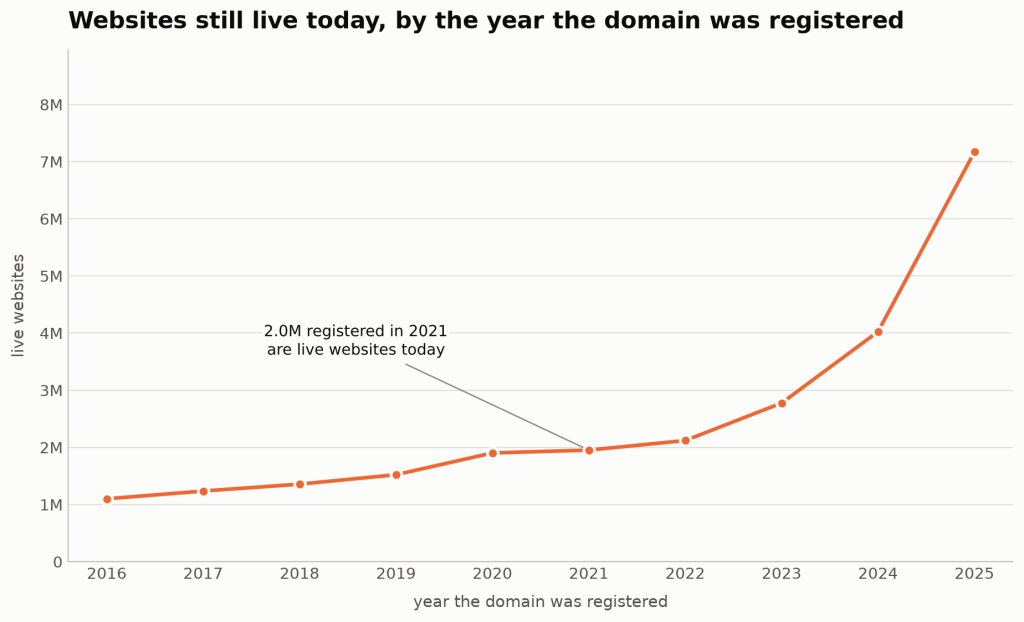
I’m working with a dataset Automattic licenses from DomainsBot. DomainsBot runs a crawler (a program that visits every domain name it knows about, every couple of months, and records what it finds). I’d like you to have a quick look at the number of .com websites that are currently live (where live means, at the very least, that there’s a real homepage), grouped by when the domain was registered:
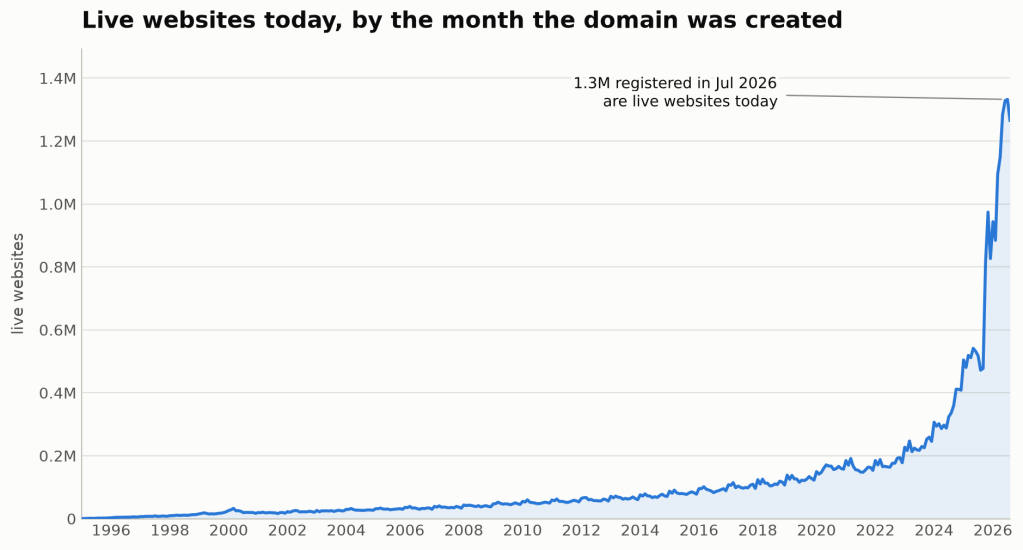
Wow. Looks to me like the web is really taking off. Who knew? Unfortunately, the internet isn’t actually growing quite as fast as that graph would have you believe. We’re falling afoul of a classic: survivorship bias.
You see, Sandra built a Spice Girls fan site in 2001 and let me tell you: it looked spectacular. But now Sandra has a husband, a mortgage, and two kids, and, regrettably, not much time to maintain her Spice Girls website. Tragically, it disappears from the internet. Sandra’s son, Gregory, takes after his mum, though, and in 2025 built a Taylor Swift fan site. Flushed with the boundless energy of youth, Gregory is still maintaining his site.
When I look at today’s picture of the internet, I see Gregory’s site but not Sandra’s, and so I underestimate the size of the internet in 2001. I have failed to predict the past. What I really need is a snapshot of what the internet was like in 2001. Alas, I don’t have one. (If you do, it’d be great if you could share that with me.)
What I do have, however, is every crawl since late October 2025. DomainsBot keeps a record of each visit, so for any .com domain, I can see what it looked like in November, and again in January, and again in March… Not too shabby, eh? So at the very least, I’m able to work out what happened on the internet from November 2025 onwards. Fine. But not great. Can we do better than that?
Data science to the rescue
Let’s be preposterously clever, and make a bunch of unfounded assumptions. If we’re to believe Nassim Taleb and his Lindy effect (the idea that the longer something has been around, the longer it’s likely to survive), we should assume that a website that’s been around for ages is more likely to stick around, and a new one is more likely to disappear. In fact, we don’t even need to believe Taleb.
Take every pair of consecutive crawls of the same domain (~170M data points in our data set) and note how old the site was when we first saw it. Then, on the second crawl, was it still live? We’ll call that chance the hazard: the probability that a site that’s live today is gone by the next crawl. Then, group by age of site, and you get an idea of the chance a site is going to disappear by how old it is.
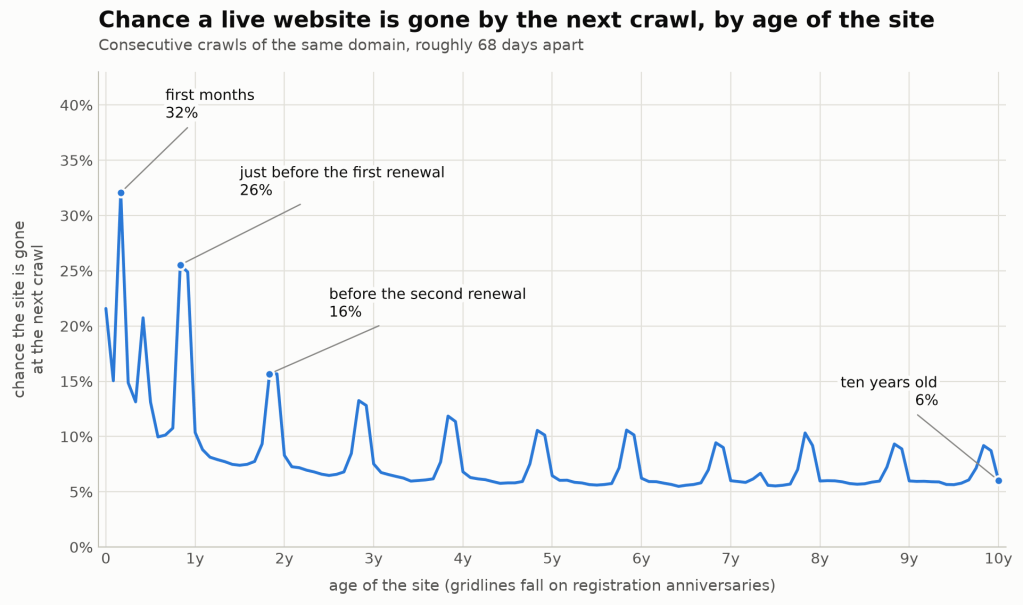
Isn’t it nice when things like that happen? Life experience and philosophizing create a principle. Data validates it. Sure, things aren’t quite so clean: you’ll see big spikes of hazard around 11 months, 23 months, and 35 months. Well, this is where we put on our common‑sense hat (or you can call it industry knowledge if you’re feeling fancy): people buy domains and hosting a year at a time, so if you’re going to give up on a site, you should probably do it when your renewal bill lands. Look at the spikes on the graph above—just before each anniversary.
Okay! So we’ve validated the principles and created a fancy graph. Job done, amirite? We just chain all our probabilities together and project backwards. A nine‑month‑old site has an x% chance of being gone next month. A 10‑month‑old site has a y% chance. Multiply together, wind back…and…ah.
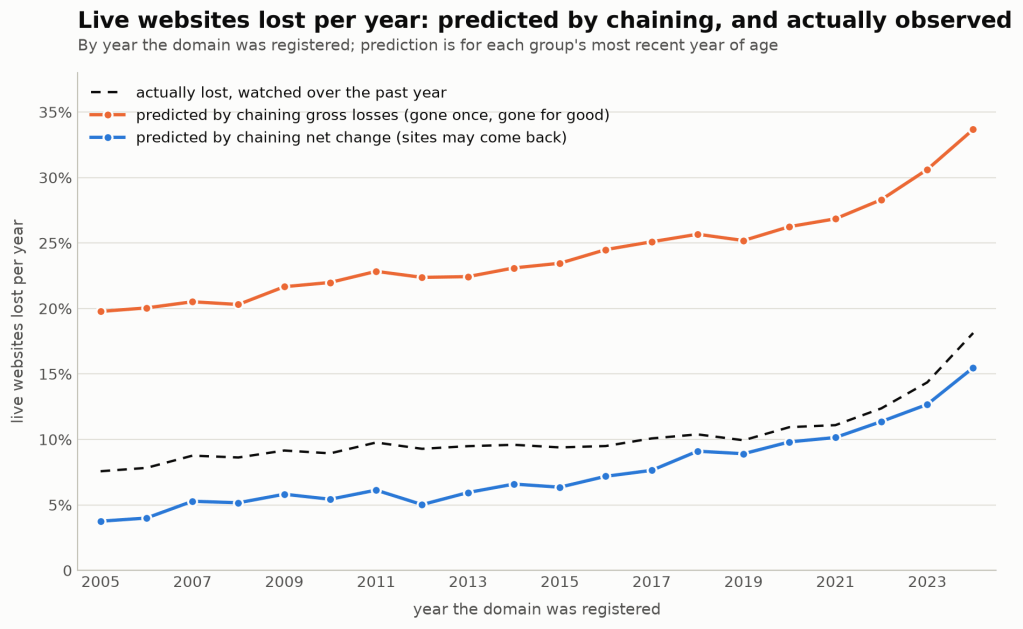
Ignore the blue line at the bottom and focus on the orange one at the top. According to it (silly, nonsensical line), sites registered in 2016 should be losing about 25% of their number every year…except in the year we watched them, 9.5% actually disappeared. Those assumptions, then, look like nonsense. Fancy nonsense. But nonsense all the same.
The problem, and we shouldn’t criticize mortality researchers too heavily for this, is that survival analysis typically assumes that when something dies, it stays that way. Arguably true for humans, but definitely not true for websites. A site can vanish because an owner forgot to renew, the server fell over, or a redesign is only partway through. Hazard isn’t quite the number that we want. Instead, we want the net change: sites that came back or were new, minus sites that went dark. Remember that blue line I told you to ignore? Remember it again, because that’s what that line is!
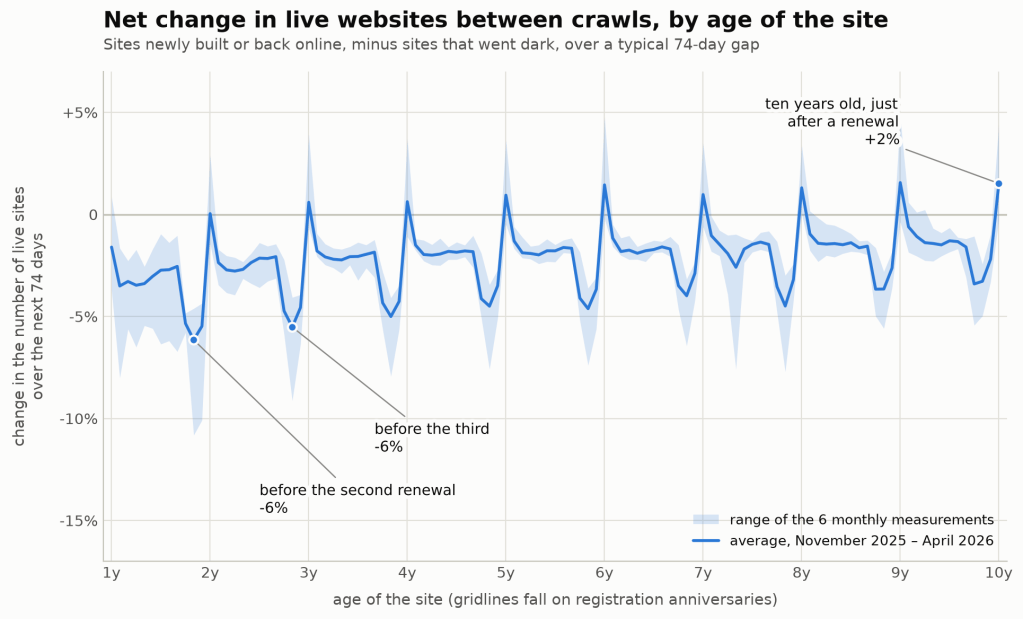
Now we’re cooking. So we take our chart that allows sites to come back to life, we chain our probabilities at each age, we multiply back, and we can estimate how many sites from 2016 leave the number we see today. Looking at the net figure is what really matters. Ten‑year‑old sites lose about 6% per crawl if you only count departures. But just after their tenth anniversary, the net change is actually positive (+1.5%).
“But you can’t do that,” I hear some astute readers complain. “You’re assuming that there’s a constant hazard rate and…”
SNORE. In the immortal words of Martin Brundle, British racing broadcaster, “I can do that, because I did.”
Now, before you accuse me of outright barbarity in my data practices, remember I told you that I have a crawl history? That means I don’t just have one hazard measurement; I have ten of them! With ten measurements, I can look at the stability of those rates (plotted here):
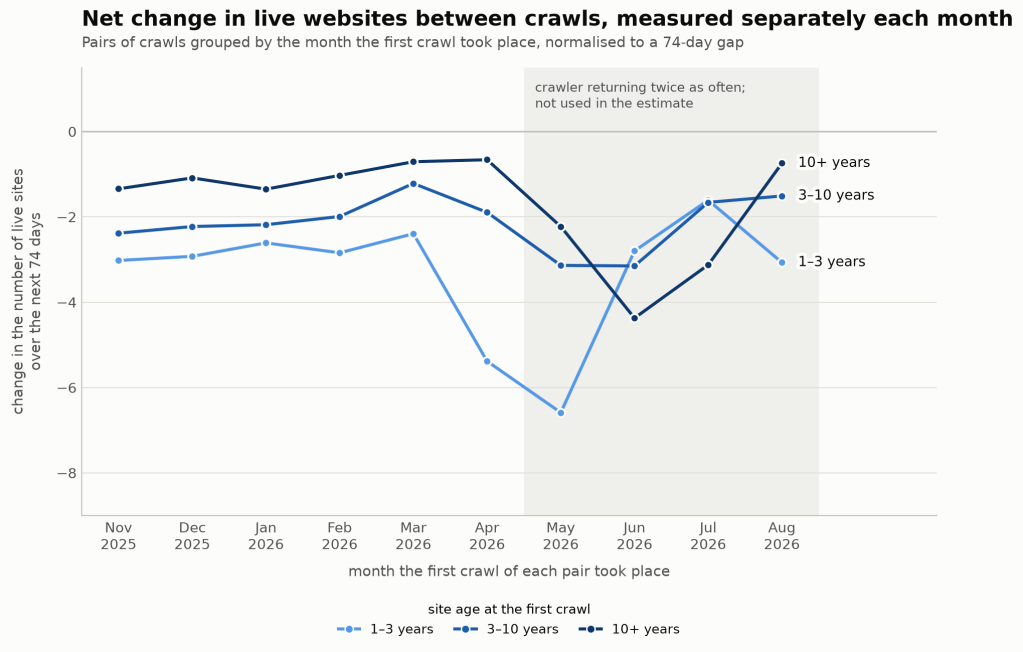
As you’ll see, it’s pretty consistent from November to April. After that…not so much. That lack of consistency is actually a feature of the crawl, rather than the web itself.
The benefit of a crawl history is that I can assess how close to being right I was: If, in October, I try to backwards forecast how many sites there were in November 2025, how close to being right was I?
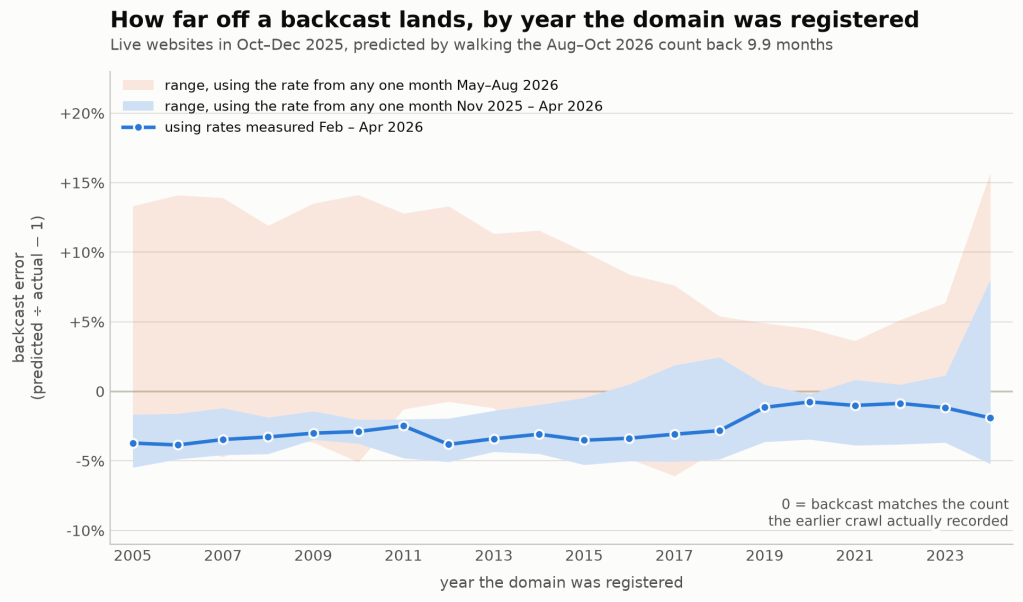
Using loss rates measured only in between February and April, and walking the October count for each registration year back ten months, we end up about 1–4% below the “true” value. Every single year comes out a little low. Use the rate from any one month after April instead, and you can miss by as much as 16%.
What does all this mean, when put together, then? Well you take a graph like this:
Do all our backward propagation of hazard rates, and you end up with this:
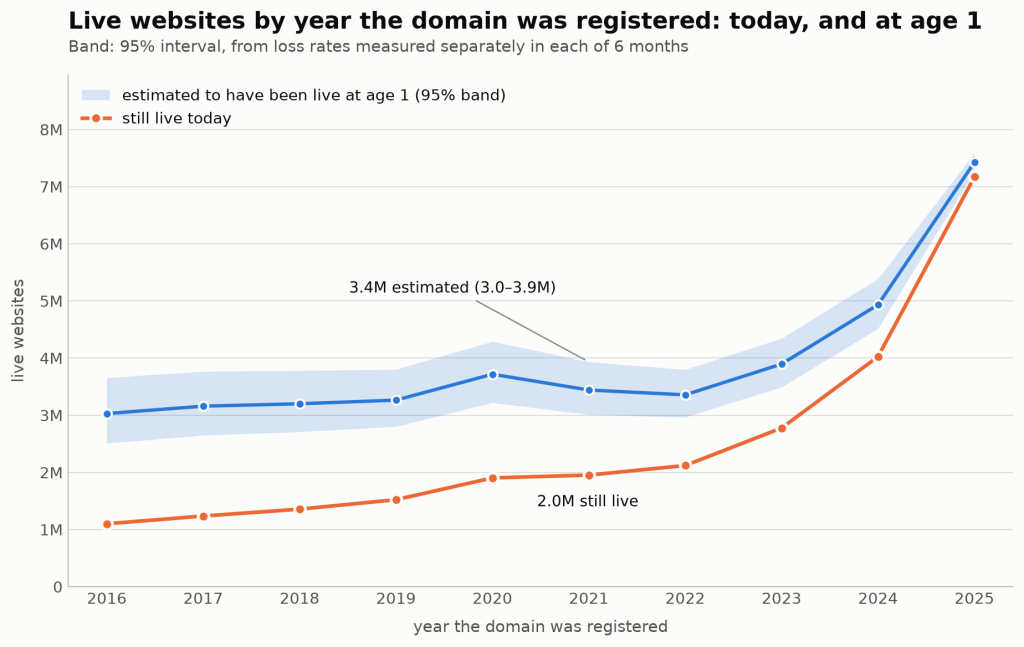
Our error bars come from six different versions of the hazard curve (one created from each month between November, 2025 and April, 2026). Each curve gives a different answer, and our error band is the 95% interval for their mean. Those error bars show how much the six months disagree with each other.
Of course, I have to give some caveats. I’m estimating hazard rates over a relatively short time window. If anything major happened on the web at any point between 2000 and 2025, this method is likely to run into problems. Surely COVID lockdowns can’t have changed website‑making behavior? Or the release of Facebook and Instagram and the closed web? I’m also assuming age‑related mortality is the whole picture. Maybe sites created in 2014 were unusually long‑lived, and it’s a property of the site creation month itself, rather than site age, that determined mortality. And, like a coward, I stop in 2016. The further back you go, the more all of those bad assumptions start to compound.
Okay, fine, this method isn’t perfect. But in the battle between “well, there’s survivorship bias, but we’re not sure by how much and…you know…just…guess, or have you tried not being interested in this question?” versus anything else, I think this approach is better.
So…how big was the internet? Or at least, how many new .com sites did each year produce? If you only count sites that are still around, 2025 produced about 5.5 times as many as 2016. Include the ones that have since moved off this mortal plane, and it’s more like 2.5 times as many. Interestingly, the corrected line is almost flat from 2016 to 2022, and the growth has largely happened in the last three years.
You’ve seen data scientists make a meal of predicting the future. I’m hoping you’ve never seen one make such a meal of predicting the past. Questions? Concerns about the methodology? Kindly leave a comment.


Leave a Reply