

Visit a free WordPress.com site, someone’s blog, portfolio, or shop running on our free plan, and you’ll see a thin free‑site bar at the top of the page. It’s one of the main places we invite visitors to start a site of their own. In September, we tested a new version: blue instead of white, and “Create your own website” instead of “Design a site like this”.
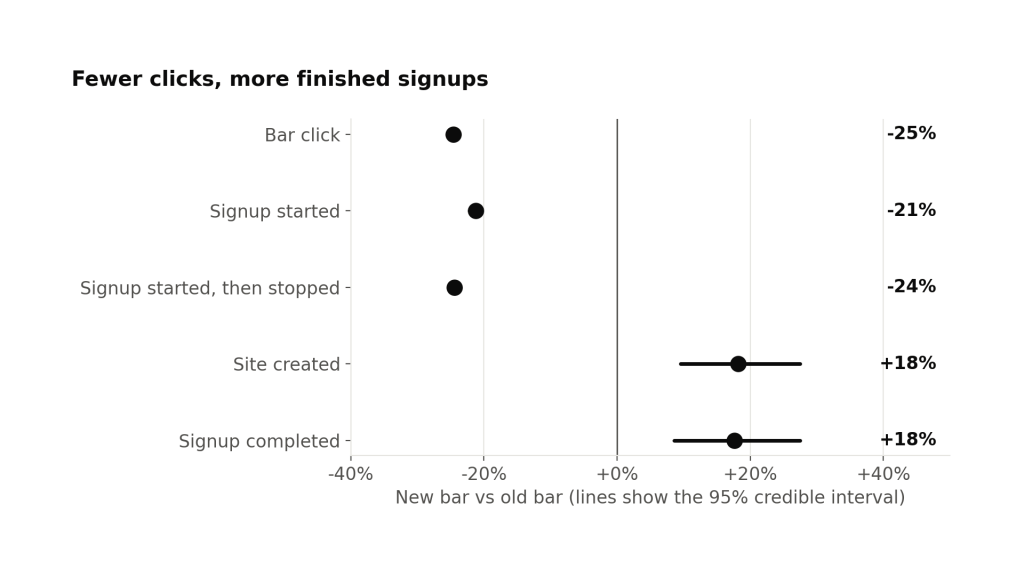
We expected the new bar to get more clicks. It got fewer, which surprised us, and it still brought in 18% more new sites.
What we changed
The free‑site bar sits at the top of logged‑out visitors’ pages on free WordPress.com sites. It’s a small invitation to go from reading someone else’s page to building your own.
The old bar was a mostly‑white strip reading “Design a site like this with WordPress.com”, with a dark “Get started” button. The copy framed the offer around the site the visitor was already looking at, not the one they might build.

The new bar is WordPress.com blue, with a visitor‑focused message, “Create your own website, free on WordPress.com”, and a “Start free” button. Our idea was “Design a site like this” sounded like an offer to copy the site you were reading, and that “your own website” would be clearer.

Both bars sent people into the same sign‑up flow. We only changed the bar itself, so any difference between the two groups is attributable to the bar.
Fewer clicks, more sites
We ran the test from September 23 to October 14, 2026, on logged‑out visitors in English locales. Each visitor was randomly assigned to the old bar or the new one, half and half.
The new bar lost a quarter of its clicks, almost all from people who left at the first sign‑up screen. Clicks on the new bar still produced 32% more sites.
The full sign‑up funnel shows how both can be true.
The first two steps, clicking the bar and starting sign‑up, went down together. Most of the lost clicks came from people who started sign‑up and stopped right there. Every step after that went up. New sites created is up 18.2% (likely somewhere between +9% and +27%).
The outcomes further down the funnel, like launching a site, buying a plan, or cash sales, didn’t move in a direction we can be confident about yet. We’re not reading much into those for now.
Projected across a full year at full rollout, the new bar would add roughly 18% more new sites every year from English‑speaking visitors.
Where the gain came from
A drop in clicks could, in theory, leave us with fewer total sign‑ups even if each click converted better. That isn’t what happened. The 18% gain is measured across every visitor in each group, not just the clickers. So the new bar brought in more sites in total, not just a better rate on fewer clicks.
The cleanest way to see where the gain came from is to split each group by whether the visitor clicked the bar at all.
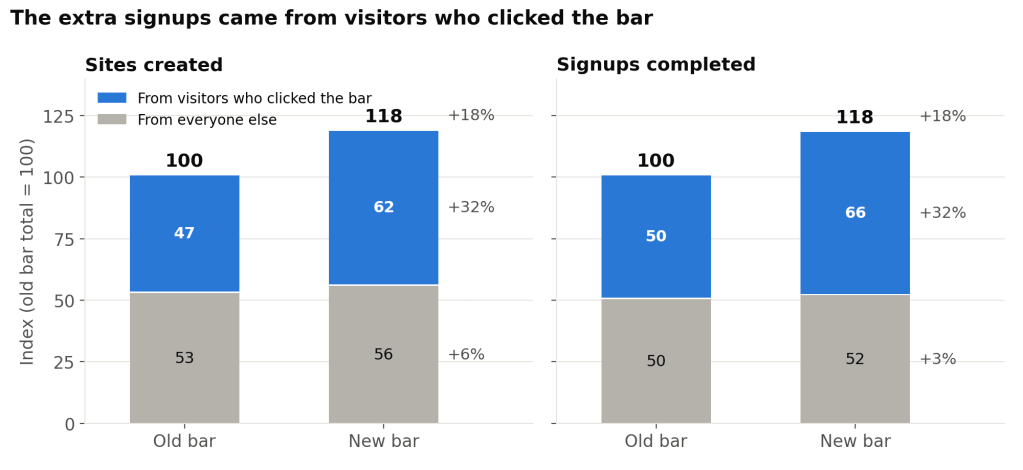
Among people who clicked the new bar, we got about 32% more completed sites and sign‑ups than from clicks on the old one, with 24% fewer clicks to work with. On a per‑click basis, almost twice as many clickers went on to create a site.
Among people who never clicked, nothing moved. That fits: if someone never clicks the bar, its wording has no way to change what they do.
The phone story
The pattern is sharpest on phones. There, the new bar got fewer clicks but more new sites, and the sign‑up starts it lost never reached a second step. That suggests many of the old bar’s clicks on phones were low‑intent taps rather than real interest.
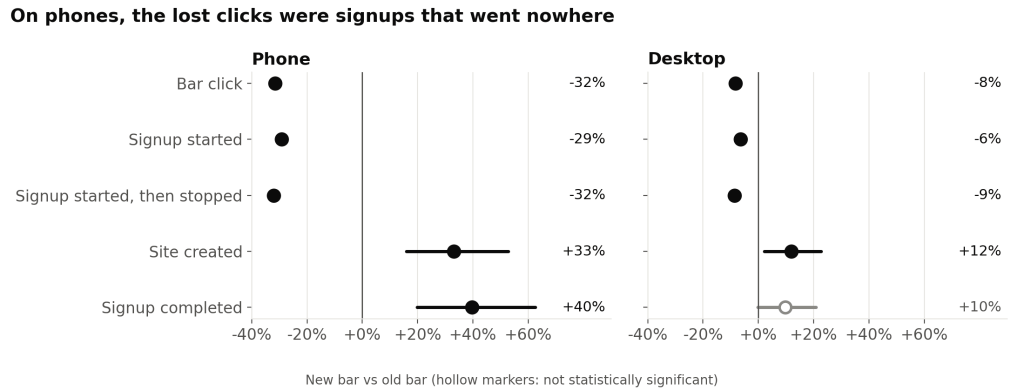
On phones, the new bar lost about a third of its clicks. Every lost sign‑up start was from someone who tapped once and never went past the first screen. New sites rose by about a third. The desktop and tablet showed the same shape at a smaller scale.
How we caught a logging bug on day 3
Three days in, the experiment platform’s sample ratio mismatch (SRM) check flagged the test. The check runs a chi‑square test comparing how many people each group counted against the planned 50/50 split. Among visitors counted as having seen the bar, the new bar’s daily share was 49.0% to 49.6%. At our traffic level, a gap that size is far too large to be chance (p < 0.001).
The bug was in exposure logging, not in assignment. Assignment is the random draw that puts a visitor in a group. Exposure is a separate event, logged when the bar actually renders, and the platform’s default analysis counts people from their first exposure. When a visitor’s assignment took longer than the page’s timeout to load, the old bar still logged the exposure, but the new bar put it off until the visitor’s next page view. Visitors who left after one page were assigned to the new bar but never logged as having seen it. That removed a specific kind of visitor, quick one‑page visits, from one group only, so the exposure‑based comparison was biased.
We fixed the logging on day 3. From then on, the daily split held within 0.1 points of 50%.
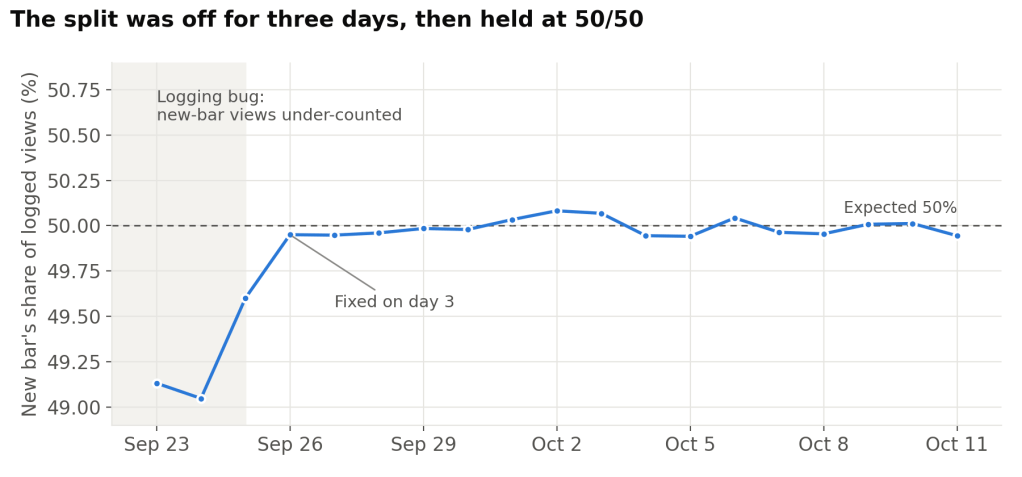
We didn’t have to restart the test. Assignment was logged on its own and the bug never touched it, so we switched to an intent‑to‑treat analysis: everyone is counted from the moment they were assigned, whether or not their exposure was logged. We still excluded visitors who saw both bars and traffic that looked like bots. Those groups are balanced (p = 0.79), and they are what every result in this post uses. Counting from assignment includes many visitors who never saw the bar. That makes absolute rates look small and the intervals a little wider, but it doesn’t bias the lift, because those visitors are split evenly between the groups.
As a second check, we re‑ran the analysis the default way, counting from first exposure, but only for visitors who first saw the bar on day 7 or later, a few days after the fix. That subset passes the SRM check (p = 0.64), and every step of the funnel lands within about a point of the full‑test result:
| Funnel step | Full test, counted from assignment | After the fix, counted from first view |
|---|---|---|
| Bar click | −24.6% (−25.4% to −23.7%) | −25.6% (−26.5% to −24.7%) |
| Signup started | −21.3% (−22.2% to −20.4%) | −22.1% (−23.1% to −21.1%) |
| Domain step started | +14.1% (+10.1% to +18.3%) | +13.9% (+9.5% to +18.5%) |
| Plan step submitted | +17.9% (+8.9% to +27.7%) | +18.3% (+8.2% to +29.3%) |
| Site created | +18.2% (+9.5% to +27.5%) | +18.5% (+8.9% to +29.0%) |
| Signup completed | +17.7% (+8.6% to +27.5%) | +18.7% (+8.5% to +29.9%) |
Table shows the change for the new bar vs the old bar, with 95% credible intervals in parentheses. The post‑fix subset is smaller, so its intervals are a bit wider.
If you run A/B tests, two habits made this a quick fix instead of a do‑over:
- Check that your groups are still balanced among the people you actually analyze, not only at assignment. A clean 50/50 split at the start can hide a lopsided one further down.
- Log assignment separately from exposure. If exposure logging breaks, you can analyze by assignment and keep the data you already have.
What we’re taking from this
The redesign is shipped to all visitors on free WordPress.com sites. A few things from this round are shaping how we think about the next ones:
- Click‑through isn’t the goal. We went in expecting the new bar to win on clicks. It lost clicks and still won on sign‑ups, which is what we actually care about. If we had judged the test on clicks alone, we would have kept the old bar.
- Small changes add up. The bar is seen by a lot of visitors every month, so even a small redesign can mean many more new sites over a year.
- The new bar is now the baseline. Our next tests, with different copy, different visuals, and different destinations after the click will be compared to this version.
A note on methodology
The experiment is a 50/50 random assignment, run on logged‑out visitors to free WordPress.com sites in English locales. The primary metric was clicks on the bar within an hour of a visitor being first assigned to a group. Sign‑up steps were tracked within 24 hours. A site‑launch check ran out to 7 days.
The ranges in this post are 95% credible intervals from our experiment platform: given the data, there’s a 95% chance the true effect lies inside the range. When the whole range is above or below zero, we call the result statistically significant. We counted every visitor from the moment they were first assigned, and excluded anyone who ended up seeing both versions, which keeps the comparison fair.
We caught and fixed a logging bug on day 3; see the section above for how that worked.
Purchases, cash sales, and short‑term engagement didn’t show measurable changes in this test. Very few visitors buy a plan within 24 hours of seeing the bar, so this test wasn’t powered to detect purchase changes. We’ll keep watching over time.


Leave a Reply