Recently, Automattic created a Marketing Data team to support marketing efforts with dedicated data capabilities. As we got started, one important question loomed for me and my teammate Demet Dagdelen: What should we data scientists do as part of this team?
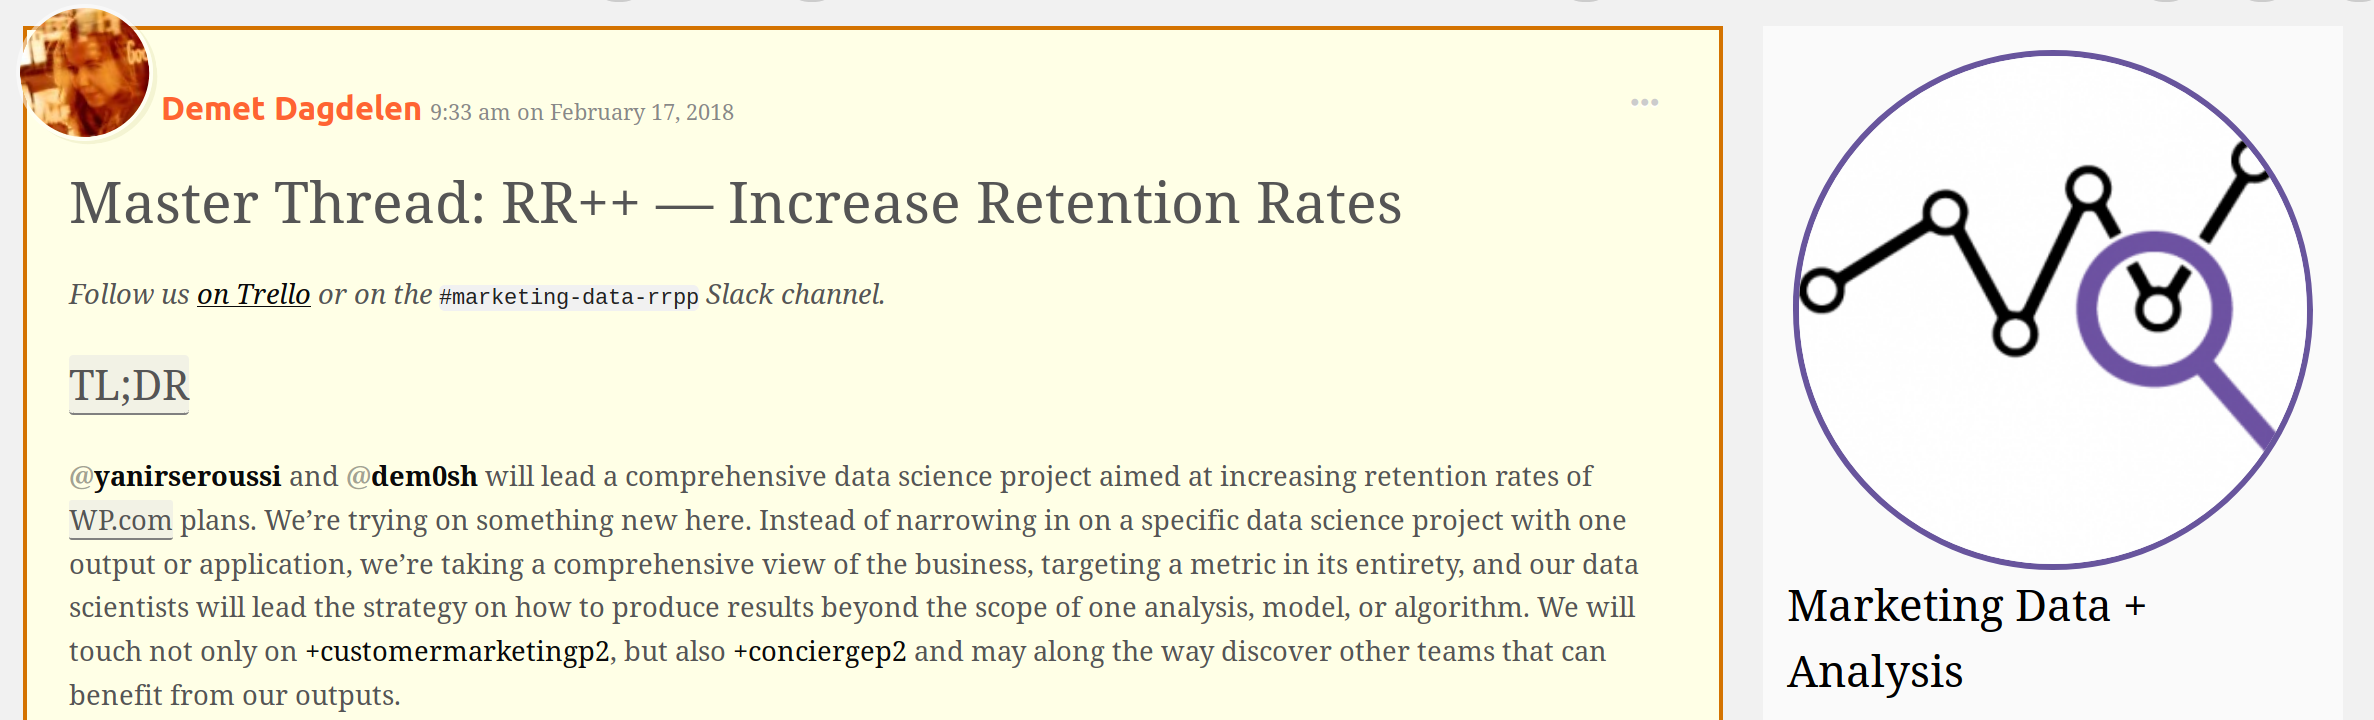
Even though the term data science has been heavily used in the past few years, its meaning still lacks clarity. My current definition for data science is: “a field that deals with description, prediction, and causal inference from data in a manner that is both domain-independent and domain-aware, with the ultimate goal of supporting decisions.” This is a very broad definition that offers a vague direction for what marketing data scientists should do. Indeed, many ideas for data science work were thrown around when the team was formed. Because Demet and I wanted our work to be proactive and influential, we suggested a long-term marketing data science project: RR++ (Increase Retention Rates). This post is a high-level overview of the story of RR++ and the lessons we learned while working on it.
Defining the project
The problem of increasing retention rates is very broad, but it is obvious that for an established subscription-based business like WordPress.com, any increase in retention rates translates to increased long-term revenue. The general idea was to keep the high-level focus on retention rates in mind and see where it’d take us:
We began by breaking up the work into specific milestones and tasks. It was clear that there were too many unknowns to be able to plan everything in advance. Instead, we decided to be flexible, define a general milestone structure, and only plan a few weeks at a time in more detail. Unknowingly, we more-or-less followed Eric Colson’s recent advice on curiosity-driven data science:

Main project tasks and outcomes
Demet and I spent most of 2018 on the RR++ project, and we could probably write an entire book on the experience. To summarize, here is a high-level overview of the main tasks and outcomes of the project in rough chronological order.
Consistent definition of retention for the project. Problem definition and counting are two of the hardest parts of data science. Therefore, one of our first RR++ tasks was agreeing on a definition of retention for the project and capturing it in a derived table that all subsequent analyses would rely on. This included answering questions on the level of measurement (e.g., subscription, site, or user?), what constitutes retention (e.g., is a downgrade to a different paid plan considered churn?), and timeframes for plan renewal (e.g., should a temporary failure to renew due to an expired credit card be seen as churn?).
Research on past and current retention work. Any good research project starts with a review of existing efforts in the field, and RR++ was no exception. As most of the communication within Automattic is written and archived for future reference, there was plenty of material to get through. After summarizing our findings, we asked our colleagues for their questions on retention, with the goal of guiding our initial data dive.
Simple retention analysis. Once we had our retention definition and table in place, it was time to run some basic analyses to ensure that our data matched existing resources. We visualized the data with cohort-based retention curves, and used the Python lifelines package to perform basic survival analysis.
Consistent and repeatable feature generation process. Answering the most interesting retention questions requires going beyond the basic retention data to uncover factors associated with churn. Such factors are commonly referred to as features. In our case, features are characteristics of sites and users. When we started working on RR++, pipe (the Automattic machine learning pipeline) had some rudimentary feature generation capabilities, but there was no way of using the features outside of pipe. To facilitate reproducible analyses with pipe-generated features, we extended pipe to include a command to generate features for any list of sites or users. We also spent several weeks defining all the features we could think of that may be related to retention, and wrote queries to extract them from various database tables. This part of RR++ turned out to be useful for many projects, so we now have data engineer Rob Landers working on scaling the feature generation process and storage, and making features available through a standalone system.
Feature-based survival analysis and pipe retention models. With a reliable feature generation process and a large number of features to explore, it was time to dive deeper into the data. I focused on feature-based survival analysis and regression, while Demet worked on extending pipe’s capabilities to support building retention models. Both directions yielded similar results in uncovering factors that lead to churn. Notably, one repeated finding was that not mapping a custom domain to a site (e.g., using datadotblog.wordpress.com instead of data.blog) was very likely to lead to churn. Unfortunately, the large effect of this factor turned out to be due to a bug in the query we used for generating the domain mapping features. However, this part of the project yielded many other non-buggy insights, like high site traffic and user activity being early indicators of retention. In addition, the pipe retention models were reasonably accurate despite minimal tuning, which meant they could potentially be used for retention-increasing interventions.
Productionizing predictive model deployment with pipe. To enable interventions based on pipe retention models, we had to ensure that pipe could provide scores continuously without relying on manual work or on any individual’s environment. As with the feature generation phase, we ended up implementing a process that can be used to deploy any predictive model. For details check out our posts on pipe.
Initial interventions to increase retention. Once we had retention models running in production, it was time to use their scores for the main RR++ goal: increasing retention rates. The first intervention was fairly simple — we exposed the relative churn risk of sites in our internal support tools. The idea was that knowing that a user owns a site that is at risk of churning would help support staff drive conversations around increasing retention. However, there’s still work to be done in that area, like showing the reasons for churn and being more proactive about contacting at-risk users. Such proactiveness was demonstrated by our second intervention, where we worked with marketers to run an email campaign to encourage early upgrades from a one-year plan to a two-year plan. Our findings from this campaign show that targeting users based on their retention scores yields superior results to unsegmented targeting.

Lessons learned
Working on RR++ has been a fulfilling experience due to the outcomes we delivered and the lessons we learned along the way. We hope that our reflections will be useful for others contemplating similar projects.
Curiosity-driven data science works. We didn’t know what the outcomes of the project would be when we proposed to focus on the high-level business goal of increasing retention rates. But we knew that keeping this goal in mind would set us on a path that’s aligned with the interests of Automattic and the marketing division. To add one more example to the outcomes described above, my curiosity about survival analysis — which I haven’t explored before RR++ — has unexpectedly led me to help our HR department predict attrition rates of Automattic employees, using the same basic technique we used for RR++. In addition, the tools we created are being used across Automattic. For example, we are working with the Jetpack division to use pipe for their retention models, thereby saving them a lot of work in comparison to building and deploying models from scratch.
Verification of ever-changing data and pipelines is challenging, but crucial. As noted above, we reported incorrect results due to a bug in the extraction of domain mapping features. This happened despite performing thorough code reviews and implementing automated tests. As anyone who’s worked with software knows, unless you’re writing trivial code, bugs can creep in even with rigorous verification. Our code is far from trivial, and it relies on live data that can change without warning. This doesn’t mean we should give up on manual and automated verification — it just means that we can never test everything. Verification allows us to increase our belief that the results we report are valid, but it doesn’t completely eliminate the possibility that some bugs exist. Just like with traditional scientific research, our outputs represent our best knowledge at the time of publication. If new information becomes available — such as discovering that our assumptions on domain mapping were wrong — our reported results change accordingly. This is summarized by a quote commonly attributed to John Maynard Keynes: “When the facts change, I change my mind. What do you do?” Rigorous verification is required for reducing the likelihood of unexpected changes, but it can’t cover unknown unknowns.
Be clear about uncertainty. The uncertainty in RR++ was high, as we didn’t have well-defined deliverables ahead of time. We did our best to communicate this uncertainty, and we were lucky to have the support of our team and division leads in pursuing the somewhat-vague goal of increasing retention rates. In addition to the uncertainty that came from the project definition, there were other unknowns around data reliability (as discussed above) and random variability of statistical estimates. Again, we committed to being open about these sources of uncertainty and aimed to quantify it, rather than pretending that it doesn’t exist.
Work closely with stakeholders ahead of time. While we were mostly independent in our work, we had some dependencies on other teams. For example, running the pipe-driven email campaign required help from our Customer Marketing colleagues. We met throughout the year, but when the time came to implement the campaign, our proposed approach to using pipe wasn’t fully clear to them. We could have done a better job of keeping them up to date, though Demet and I also went through many iterations until we agreed on the experimental design for the campaign. The approach we came up with wasn’t as simple to explain as a classic A/B test — Demet will post about it in the near future.
Working in a pair with the same person for a long time is both challenging and rewarding. Before RR++, neither Demet nor I have worked so closely with another person for such a long period of time. As I’m based in Australia and Demet is based in Hungary, our work hours rarely overlap. However, this hasn’t stopped us from reviewing hundreds of pull requests by each other and having very deep discussions across multiple channels, mostly asynchronously. As one would expect, this wasn’t always a smooth ride — we had many disagreements and even arguments along the way. But we learned a lot in the process and delivered outcomes that wouldn’t have been possible had we worked independently.
A project acronym should be a pronounceable word. RR++ is a bit of a mouthful — just try saying “ar ar plus plus” out loud. Also, the plus symbol can’t be used everywhere, so we changed it to rrpp in file and table names. Choosing that name wasn’t our best decision. For our next project, we’ll choose a better name, like pipe — simple, monosyllabic, and meaningful.
Beyond RR++
When we first conceived the project, retention was an underserved area at Automattic. Now, there’s an entire team dedicated to retention marketing, as well as other retention projects. As we spent plenty of time on building general capabilities into pipe, it became clear that it can be used to serve other marketing and company goals than retention modeling. Going forward, we’ll focus our attention on pipe and its marketing applications. This still includes driving retention campaigns, but we are also aiming to support acquisition and upselling efforts, among other things. We will share more insights from our work in the future. Subscribe to this blog if you want to hear about our adventures beyond RR++!

Leave a comment