Fresh data insights from Automattic.
Dive into our blog where we turn complex data into clear, actionable insights. Stay tuned for fresh perspectives and expert advice from the heart of Automattic’s data team.
-
This Week in Data Reading
In this week in data reading, Demet offers up some digital anthropology over at FiveThirtyEight while Charles shares two papers he enjoyed in the field of natural language processing, and Carly offers a piece on back propagation.

-
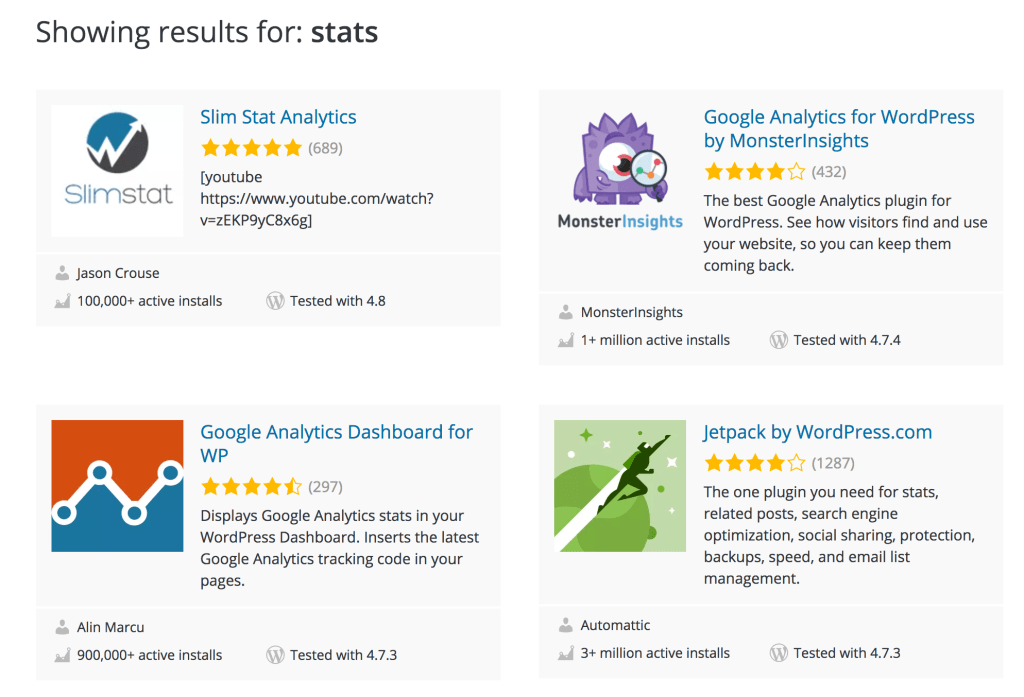
Improving Relevance and Elasticsearch Query Patterns
The WordPress.org plugin directory has been significantly rebuilt over the past year and should go live soon (test site). Many from across the WordPress community helped with this effort. I focused on improving plugin search relevancy. This was a great learning experience on how to build more relevant searches for a couple of reasons: There…
-
This Week in Data Reading
This week, Boris, Demet, Charles, and Sirin offer pieces on data visualization, deep learning architecture, the “Dirtbag Left,” and an obituary for the late Hans Rosling, a man who “had a talent for using numbers to tell exciting stories” — largely about the world becoming a better place. Enjoy our recommendations below and remember to…

-
How’s Your New Year’s Resolution Going?
Talking with friends last week, many of us sheepishly admitted that we have already “broken” our 2017 resolutions. According to a popularly cited study by Norcross in 2002, only 64% of 150 participants who had made resolutions were able to stick with them beyond a month. A recent Marist poll lists some popular choices for…

-
This Week in Data Reading
This week, Boris and Charles bring you two new resources for data reading and pose some questions for discussion on how you approach scientific literature, and you detect and deal with bias inherent in your applications. Looking forward to your comments!

-
Intro to Search: Measurement
Welcome to the third part of our mini-series “Intro to Search.” In my previous posts, I’ve discussed the characteristics of great search results and what a search engine looks like from the inside. But, how do we know if our algorithms actually deliver relevant search results? The answer is, of course, by measurement! There is…

-
This Week in Data Reading
There’s nothing tastier than a set of links to devour! Check out what we’ve been reading recently and be sure to share your links to thought-provoking articles and discussions on topics in the field of data science.

-
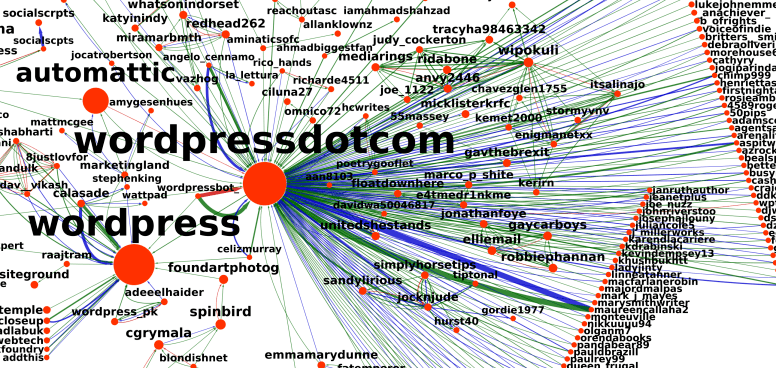
A Brand Image Analysis of WordPress and Automattic on Twitter
As a data scientist, I spend a lot of time analyzing how our users interact with WordPress.com. However, WordPress.com isn’t the only place to gain insight into how people use and talk about our services. Many WordPress.org and WordPress.com discussions take place on social media. Analyzing these discussions can help us understand what our users are…
-
Bulk Log Analytics With Hive
Leveraging the distributed powers of MapReduce to perform custom log analysis or some one-time queries on the raw data is fast and easy and you don’t even have to build a complicated ETL process to do it. The data engineering team at WordPress.com recently used this approch to query tens of billions of log lines…

-
Evolution of a Plot: Better Data Visualization, One Step at a Time
The goal of data visualization is to transform numbers into insights. However, default data visualization output often disappoints. Sometimes, the graph shows irrelevant data or misses important aspects; sometimes, the graph lacks context; sometimes, it’s difficult to read. Often, data practitioners “feel” that something isn’t right with the graph, but cannot pinpoint the problem. In this…